Thursday 7 October 2010

New Performance Management Blog

In addition to the articles below, do see the new Camwells Business Performance Management blog. This talks about  KPIs and the other aspects of driving improved business performance.

For dashboard reporting of KPIs, there is a free trial of these gauges that can be easily incorporated into Excel. A veriety of styles of gauges are available. Do take a look.

Wednesday 26 August 2009

(1) KPIs, KRMs and KPDs – what’s the difference?

The term “Key Performance Indicators” (KPIs) is often used to refer to any key business measures.

However the most useful definition of KPIs is “Measurements that tell you what to do to increase performance dramatically.”

This means thinking about what drives the business – the business “drivers” that you can directly control and action. These can be in commercial, operational or financial areas.

The “drivers” can be financial or non-financial in nature, for example margin%, conversion rate of sales leads to orders, and the % of products/services supplied on time. These reflect activities that you can directly control.

Conversely you cannot directly control measurements like revenue and profit, which result from actions taken in individual aspects of the business. These type of measurements are therefore called “results metrics”.

This means it is useful to think of KPIs in two groups:
KRMs - Key Results Metrics
KPDs – Key Performance Drivers (the true KPIs)

There’s then the significance of the word “key”. There should only be 5-10 KPIs at each level of the organisation, which link into the “Critical Success Factors” (CSFs) – the things that must happen (or not happen) for the organisation, division or department to be successful in pursuit of the strategic objectives.

So having determined the strategic objectives and CSFs of your business, what are the KRMs and KPDs needed at each level of your organisation to increase performance dramatically?

Tuesday 25 August 2009

(2) KPIs – what’s the purpose?

You’ve heard the expression “what gets measured gets done”?

The purpose of KPIs is to ensure that what ought to be done gets measured so it gets done, i.e. promote the right behaviour. KPIs also provide a method for managers at every level to monitor performance.

KPIs apply equally to businesses large and small, to the Board down to individual departments.

KPIs therefore need to be “goal congruent” with the business's strategic goals.

Conversely, it is easy to set up KPIs that detract from the business’s goals, either
(a) Directly promoting the wrong behaviour
(b) Taking eyes off the main ball by not setting required KPIs

You have to very carefully consider what behaviour would result from each KPI, and have a set of KPIs that is goal-congruent overall.

If you are already using KPIs or other business measures, are they promoting the right behaviour for your business?

Monday 24 August 2009

(3) KPIs – what size of business can benefit?

Simply any size of business - large, medium or small.

All businesses have (or should have) strategic goals where it is possible to define the Critical Success Factors (CSFs) that will drive the business forward or avoid disaster.

The KPIs provide measures that focus attention on what’s important, whether the KPIs are KRMs or KPDs - see explanation in posting (1).

In smaller businesses there may be just one set of KPIs for the entire business.

In larger businesses there needs to be a cascade of KPIs, providing management at each level with KPIs of what’s important to them in their specific role.

What’s strategically important to you and your business?

Sunday 23 August 2009

(4) KPIs – How Do They Link To Business Processes?

Imagine you are in charge of a brewery. You are in the control room and have a dashboard showing the various stages in the brewing process. These processes might include

  • Receipt of raw materials
  • Preparation
  • Fermentation
  • Filtration
  • Bottling
  • Casing
  • Despatch & sale
To maximise profit, what are the key measures you want to see on your dashboard for each stage? The measures will fall into two camps, “results” and “drivers”: (1) Key Performance Drivers (KPDs), such as:
  • Cost of materials
  • % Raw materials rejected/accepted
  • Yield of preparation
  • Temperature of fermentation
  • Energy cost of fermentation
  • Yield of filtration
  • Bottles smashed
  • etc
(2) Key Results Metrics (KRMs) such as:
  • Volume of fermentation mixture
  • Volume of beer produced
  • Number of bottles filled
  • Number of cases stacked
  • Number and value of cases despatched
  • Profit
By monitoring key measures like these you can keep a close handle on productivity and profit. Now imagine you are looking at the processes in your own business. The exact same principles can be applied, looking at the processes in typically three groups: (1) Sales/Marketing (2) Operational, including HR (3) Financial, including credit control The key is to set out the processes, consider what is important to measure, and then track the KRD and KRM metrics in some form of BI system. How do you monitor your business?

Saturday 22 August 2009

(5) Decision Support – how do KPIs and BI systems play their part?

You’re making a business decision. What do you need to know?

Obviously it depends on the situation at the time. But typically will include:
1. What will happen?
2. What’s been happening?
3. How it will impact the numbers that get reported?
4. How will it affect your own remuneration or bonus?

You may make a rapid instinctive decision. Or take the time to analyse the situation more carefully.

Either way, given the same applies to other people making decisions throughout your organization:

1. Are the numbers reported the correct KPIs to drive decisions that are right for the business?
2. Do management and sales team bonus and commission schemes tie in with business goals?
3. Do your systems provide suitable historical information on a timely basis? Can you see the big picture? And analyse into detail when you need to?
4. Do you have an overall forecast in mind? And have a model to test out major changes in scenarios?

Relevance of KPIs

Clearly the right KPIs at each level in the business are vital, including remuneration schemes. See earlier posts in this blog for further discussion and ideas.

What about Business Intelligence (BI) systems?

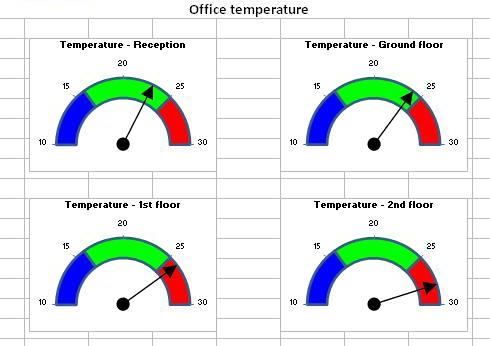
Well-implemented BI systems can provide dashboards of KPIs, analysis into detail, and models to help forecast the future.

You can use Excel, a BI tool that sits behind Excel, or a BI tool with its own user interface. Key considerations are power, ease of use, and reliability.

Excel can be good for simpler situations, but it’s easy to make mistakes. A back-end database or OLAP system is better, provided the business structure is well modeled. Costs can vary dramatically, and value for money even more so. Excel may be cheap, but often not best for value.

Next Step

Feel free to comment against this blog. Or do give me a call to discuss, free of charge on +44(0) 1628 632914.